How Texas Measures Up in the 2010 American Community Survey
Authors:
Anne Dunkelberg /(512) 320-0222 x 102
Frances Deviney /(512) 320-0222 x 106
September 22, 2011
American Community Survey
New data from the Census Bureau’s 2010 American Community Survey (ACS)1 illustrates that poverty and uninsured rates vary dramatically by age, race and ethnicity, and across Texas’ metropolitan areas. Our analyses of the ACS data, released September 22, focus on 10 of the most striking findings.
THE TEXAS TOP 10:
1. Older Texans were largely spared the effects of the recession.
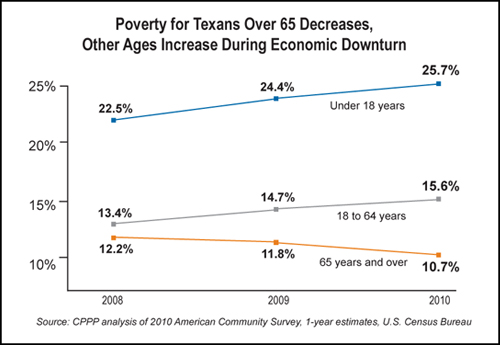
Texans over 65 saw poverty decline to 10.7 percent in 2010 from 12.2 percent in 2008 thanks to programs such as Social Security, which provides workers with retirement income, and Medicare, which provides affordable health care. Social Security and Medicare represent our collective commitment to make sure our parents and grandparents are protected against poverty in their golden years. In contrast, children and working-age Texans’ poverty rates rose during the economic downturn. More than one out every four Texas children lives in poverty.

2. Texas has four of the five worst poverty rates among U.S. metropolitan areas.2
Brownsville (36.3 percent), McAllen (33.4 percent), Laredo (31.7 percent), and Bryan-College Station (30.0 percent) have the highest rates of poverty3 in the country, far exceeding the poverty rates for Texas (17.9 percent) or the U.S. overall (15.3 percent). To view the poverty rates for all of Texas’ metropolitan areas and six comparison metropolitan areas across the country, click here.
3. The poverty gap between Hispanic Texans and non-Hispanic White Texans grew between 2008 and 2010.
Between 2008 (the year the recession began) and 2010, the poverty rate for Hispanics grew from 24.8 percent to 26.8 percent, while rate for non-Hispanic White Texans went from 8.4 percent to 9.3 percent. African American Texans and Asians also saw their poverty rates increase to 24.8 percent and 12.6 percent, respectively.
4. The majority of Texans in poverty are U.S. citizens.
Of the 4.4 million poor Texans (17.9 percent, 8th worst), four out of five are either citizens by birth or became citizens through legal naturalization.

5. Income inequality remains quite wide in 2010.
Incomes in the bottom 20 percent of Texas households dropped 2 percent between 2008 and 2010 (from $11,398 to $11,307 on average). But incomes in the top 20 percent of Texas households fell by 7 percent, from $315,888 to $291,996. The gap is still quite wide, however, with the top and bottom groups being separated on average by $280,861. Currently, Texas has the 7th worst income inequality in the country.4
6. Higher Education protects people from poverty.
People with bachelor’s degrees or higher were less affected by the economic downturn than people with only a high school degree or less. Texans 25 or older with at least a bachelor’s degree maintained a low poverty rate, moving only slightly from 3.8 percent in 2008 to 3.9 percent in 2010. In contrast, Texans with a high school degree or less were increasingly likely to enter poverty, moving from 26.3 percent to 29.1 percent in the same time period.
7. Texas leads the U.S. in the share of people who lack health insurance.
Texans who were uninsured the day they were surveyed in 2010 numbered over 5.8 million, or 23.7 percent—one in four—of all Texans.
8. Texas’ average uninsured rate hides dramatic differences in access to health care across Texas communities.
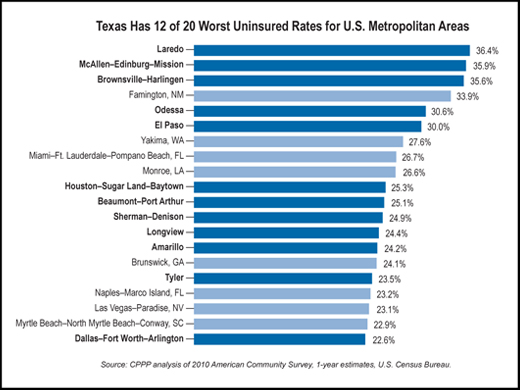
While 23.7 percent of Texans statewide were uninsured when surveyed, some Texas communities report much better rates of coverage (e.g., Killeen–Temple–Fort Hood at 15.9 percent), while others have much poorer access to coverage (e.g., Laredo at 36.4 percent and McAllen-Edinburg-Mission at 35.9 percent). The areas with the highest uninsured rates are also the areas with some of the highest poverty rates in the country and lowest median incomes. That means working-age adults are more likely to have low-paying jobs that don’t provide benefits, limiting their access to affordable health coverage through either their job or through the expensive private market.
9. Texas has 12 of the 20 worst uninsured rates for U.S. metropolitan areas.
The 20 highest U.S. metropolitan area uninsured rates range from more than one in five in Dallas–For Worth–Arlington to approximately one in three in the Laredo metropolitan area.

10. Texas’ largest cities have much worse uninsured rates than other major U.S. cities, creating special challenges.
For example DFW (22.6 percent) and Houston (25.3 percent) must respond to calls for help at a much greater rate than other major U.S. cities, such as New York (13.6 percent) and Phoenix (17.1 percent). This puts significant pressure on local communities to meet families’ needs.
What the Data Tell Us
We need to maintain the policies that have effectively reduced poverty for the elderly such as Social Security and Medicare. To reduce poverty for working-age Texans, we need to invest in education to create a better educated, more highly skilled workforce. To help working-age Texans and children, we need to successfully implement national health care reform so that all Texans have access to affordable health care. Poverty is a consequence of how we structure our society, and a problem that can be solved.
Endnotes
- Data analyzed for this report were from the U.S. Census Bureau’s 2010 American Community Survey 1-year estimates, which only include data on areas with 65,000 people or more.
- For this report, “metropolitan area” means Metropolitan Statistical Area.
- Poverty is measured by the U.S. Census Bureau depending upon the income and size of the household. For example, for a two-parent, two-child family to be considered living in poverty in 2010, their household income would have to be $22,113 or less. To view all 2010 poverty thresholds, visit http://www.census.gov/hhes/www/poverty/data/threshld/.
- Income inequality is measured by the Gini Index. The Gini Index varies from 0 to 1. A 0 indicates perfect income equality and a 1 indicates perfect inequality where one person has all the income and no one else has any.
